Python’s rising use in data science projects isn’t just hype: It’s a testament to its incredible power and versatility. Unlike specialized statistical software, Python’s flexible syntax and extensive library ecosystem make it the Swiss Army knife of data analysis. This is due in part to the plethora of Python libraries for data science that can help you deal with messy data, build intricate machine learning models, and craft stunning visualizations—all within a single, cohesive environment.
Python’s libraries are each designed to tackle specific aspects of the data science workflow. Think of them as specialized tools in a carpenter’s workshop, each with its own unique purpose. And just as the right tool can make or break a carpentry project, choosing the right libraries can significantly impact the efficiency and success of your data science endeavors. In this article, we cover the top seven Python libraries for data science and explore their benefits.
The Library Selection Dilemma
The sheer abundance of Python libraries for data science, while a blessing, can also be a curse. It’s like walking into a store with a thousand different products—great, but also a tad overwhelming. With so many options, it can be challenging to determine which libraries are truly essential, decide which ones best suit your specific needs, and figure out how to integrate them seamlessly into your workflow.
Let’s take a look at the best Python libraries for data science and how they can help build a better data science project.
1. Pandas: Your Data Wrangler
Pandas is the undisputed workhorse of data analysis in Python. It’s like a trusty spreadsheet on steroids, providing you with powerful tools to manipulate, clean, and transform your data. Need to filter outliers, merge datasets, or aggregate information? Pandas has you covered.
Think of Pandas as your data’s personal trainer—it helps you whip your data into shape, making it ready for analysis. With its intuitive DataFrame and Series objects, you can easily load data from various sources, perform complex calculations, and even visualize your results.
2. NumPy: The Engine for Numerical Power
While Pandas might be the wrangler, NumPy is the raw horsepower that drives many data science operations. At its core, NumPy provides the high-performance multidimensional array object known as the ndarray, a seemingly simple structure that is the bedrock upon which much of Python’s scientific computing capabilities are built.
NumPy provides the computational power to perform mathematical operations on arrays and matrices with native code speed. From basic arithmetic to linear algebra and Fourier transforms, NumPy’s optimized C and Fortran code (which it uses under the hood) allows you to work with numerical data in Python yet get the performance benefits (e.g. vectorization) of C, at least for the operations that NumPy supports.
Why is this essential for data science? In many cases, data is represented as arrays or matrices—think images, time series, or tabular data. NumPy’s efficient operations on these structures make it an indispensable tool for tasks like data cleaning, feature engineering, and statistical analysis, especially when combined with other Python libraries for data science.
3. Scikit-learn: Your Machine Learning Arsenal
Scikit-learn is the go-to machine learning toolbox for Python. It’s well-stocked with numerous algorithms for common ML tasks like classification, regression, clustering, and dimensionality reduction. Whether you’re predicting customer churn, classifying images, or finding hidden patterns in your data, scikit-learn provides the building blocks to perform the task.
One of scikit-learn’s greatest strengths is its consistent and intuitive interface, particularly when working with other Python libraries for data science. Whichever algorithm you choose, the steps for training, evaluating, and deploying models follow a similar pattern. This makes it easy to experiment with different approaches and find the one that best suits your problem.
In addition, scikit-learn seamlessly integrates with other data science libraries in Python, like NumPy and Pandas, allowing you to easily move from data preparation to model building and evaluation. It also provides robust tools for model selection, hyperparameter tuning, and performance assessment, ensuring that you can build models that generalize well to new data.
To illustrate the seamless integration of scikit-learn with other Python data science libraries like NumPy and Pandas, let’s walk through a practical example where we prepare data, build a model, tune its parameters, and evaluate its performance.
					import numpy as np
import pandas as pd
from sklearn.model_selection import train_test_split, GridSearchCV
from sklearn.ensemble import RandomForestClassifier
from sklearn.metrics import classification_report

# Sample data preparation using Pandas
data = pd.DataFrame({
    'age': [25, 30, 35, 40, 45] * 10,
    'salary': [50000, 60000, 70000, 80000, 90000] * 10,
    'purchase': [0, 1, 0, 1, 1] * 10
})

# Features and target variable
X = data[['age', 'salary']]
y = data['purchase']

# Splitting the dataset into training and testing sets
X_train, X_test, y_train, y_test = train_test_split(X, y, test_size=0.2, random_state=42)

# Model building using RandomForest and scikit-learn
model = RandomForestClassifier(random_state=42)

# Hyperparameter tuning using GridSearchCV
param_grid = {
    'n_estimators': [10, 50, 100],
    'max_depth': [None, 10, 20, 30]
}
grid_search = GridSearchCV(estimator=model, param_grid=param_grid, cv=3)
grid_search.fit(X_train, y_train)

# Best model after hyperparameter tuning
best_model = grid_search.best_estimator_

# Evaluating the model
predictions = best_model.predict(X_test)
print(classification_report(y_test, predictions))

# Output the importance of each feature
feature_importances = best_model.feature_importances_
print("Feature importances:", list(zip(X.columns, feature_importances)))
The Exaloop Advantage: While scikit-learn is remarkably powerful and user-friendly, training and evaluating large models on extensive datasets can be time-consuming. This is where Exaloop can lend a helping hand. By leveraging parallel processing and hardware acceleration, Exaloop can expedite the preprocessing, training and prediction phases of your machine learning pipelines, allowing you to experiment with more complex models and larger datasets without sacrificing speed.
4. Matplotlib and Seaborn: Your Data Visualization Dream Team
In the world of data science, insights are only as valuable as your ability to communicate them effectively. That’s where Matplotlib and Seaborn come in—together they’re a power combination that empowers you to create appealing, informative visualizations to bring your data to life.
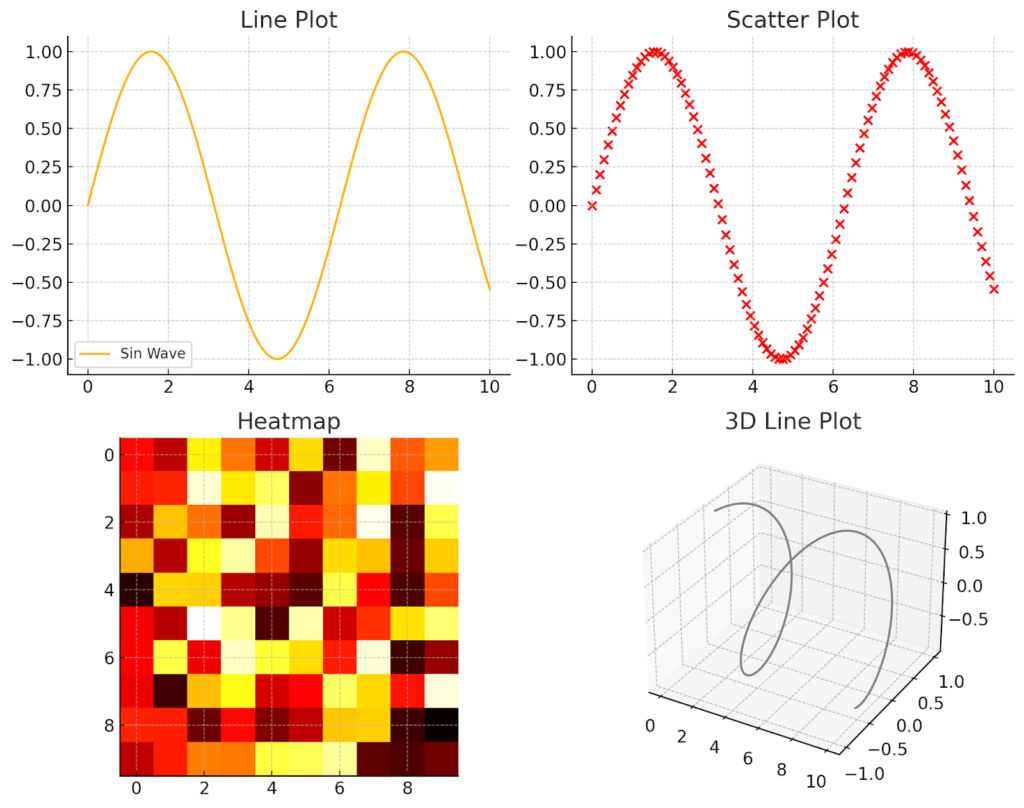
Matplotlib, the grandfather of Python visualization libraries, is like a blank canvas. It provides you with the building blocks to create a wide variety of charts, from simple line plots and scatter plots to complex heatmaps and 3D visualizations. With Matplotlib, you have complete control over every aspect of your plots, including colors, fonts, axes, and legends.
To demonstrate Matplotlib’s versatility, consider the following Python code snippet, which creates four different types of plots:
					import matplotlib.pyplot as plt
import numpy as np

# Data for plotting
x = np.linspace(0, 10, 100)
y = np.sin(x)

# Creating multiple types of plots
plt.figure(figsize=(10, 8))

# Line plot
plt.subplot(2, 2, 1)
plt.plot(x, y, label='Sin Wave')
plt.title('Line Plot')
plt.legend()

# Scatter plot
plt.subplot(2, 2, 2)
plt.scatter(x, y, color='red')
plt.title('Scatter Plot')

# Heatmap
plt.subplot(2, 2, 3)
data = np.random.rand(10,10)
plt.imshow(data, cmap='hot', interpolation='nearest')
plt.title('Heatmap')

# 3D plot
ax = plt.subplot(2, 2, 4, projection='3d')
z = np.cos(x)
ax.plot3D(x, y, z, 'gray')
plt.title('3D Line Plot')

plt.tight_layout()
plt.show()
This code produces four distinct visualizations:
Line Plot: A simple graph representing a sine wave, showcasing trends over a continuous variable.
Scatter Plot: A diagram using red points to depict the relationship between two variables, ideal for spotting patterns and outliers.
Heatmap: A graphical representation of data where values are depicted by color, useful for highlighting variances across a dataset.
3D Line Plot: A three-dimensional plot that adds depth to the visual representation, enhancing the analysis of complex datasets.
However, this level of customization can sometimes come at the cost of convenience. This is where Seaborn shines. Built on top of Matplotlib, Seaborn offers a higher-level interface that streamlines the creation of nice-looking plots. Its default styles are elegant and modern, and its specialized functions make it easy to create complex visualizations like pair plots, violin plots, and heatmaps with just a few lines of code.
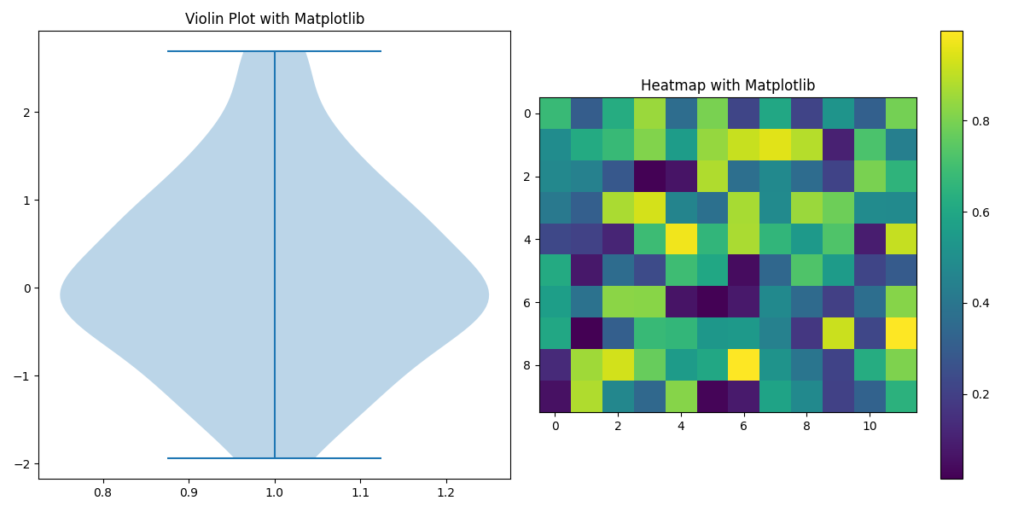
To illustrate this, compare the following code examples that create violin plots and heatmaps using Matplotlib and Seaborn:
Matplotlib Code for Violin Plot and Heatmap
					import matplotlib.pyplot as plt
import numpy as np

# Generating random data
data = np.random.normal(size=100)

plt.figure(figsize=(12, 6))

# Creating a violin plot with Matplotlib
plt.subplot(1, 2, 1)
plt.violinplot(data)
plt.title('Violin Plot with Matplotlib')

# Creating a heatmap with Matplotlib
plt.subplot(1, 2, 2)
heatmap_data = np.random.rand(10, 12)
plt.imshow(heatmap_data, cmap='viridis')
plt.colorbar()
plt.title('Heatmap with Matplotlib')

plt.tight_layout()
plt.show()
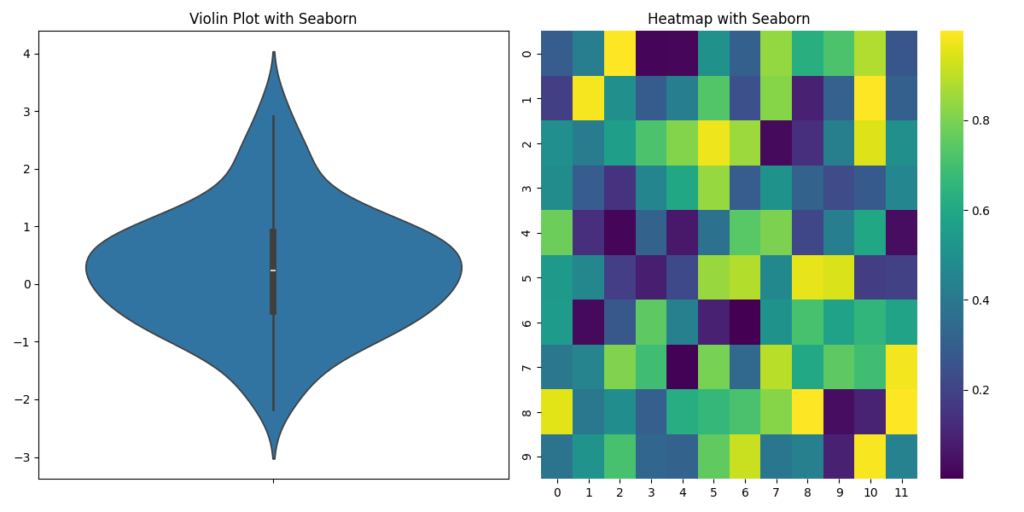
Seaborn Code for Violin Plot and Heatmap
					import seaborn as sns
import numpy as np
import matplotlib.pyplot as plt

# Generating random data
data = np.random.normal(size=100)

plt.figure(figsize=(12, 6))

# Creating a violin plot with Seaborn
plt.subplot(1, 2, 1)
sns.violinplot(data=data)
plt.title('Violin Plot with Seaborn')

# Creating a heatmap with Seaborn
plt.subplot(1, 2, 2)
heatmap_data = np.random.rand(10, 12)
sns.heatmap(heatmap_data, cmap='viridis')
plt.title('Heatmap with Seaborn')

plt.tight_layout()
plt.show()
- Matplotlib requires setting up more details manually to create a violin plot and a heatmap. While it offers extensive customization, it can be cumbersome for rapid, elegant plotting.
- Seaborn, built on top of Matplotlib, simplifies these tasks significantly. It provides a more modern and elegant default style and specialized functions that reduce the complexity and code needed to produce similar visualizations.
The demonstration of these two libraries shows Seaborn’s strength in creating complex visualizations effortlessly, validating the statement about its elegance and functionality.
Together, Matplotlib and Seaborn provide a comprehensive toolkit for data visualization in the realm of Python libraries for data science. Matplotlib gives you the flexibility to create any type of plot imaginable, while Seaborn simplifies the process and ensures that your visualizations look polished and professional.
5. Statsmodels: Unleashing the Power of Statistical Analysis
Data science isn’t just about fancy machine learning algorithms: It’s also about understanding the underlying relationships and patterns in your data through rigorous statistical analysis. This is where Statsmodels enters the scene, offering a comprehensive suite of tools for exploring, analyzing, and interpreting your data from a statistical perspective.
Using Statsmodels is like having a seasoned statistician by your side, guiding you through the intricacies of hypothesis testing, regression analysis, time series modeling, and more. It provides a rich collection of statistical models, estimation techniques, and diagnostic tools, so you can gain deep insights into your data and make informed decisions.
Whether you’re testing the effectiveness of a new drug, forecasting sales trends, or seeking to understand the factors influencing customer behavior, Statsmodels empowers you to apply statistical rigor to your data science projects. Its comprehensive documentation and examples make it easy to get started (even if you’re not a statistics expert) and to incorporate it with other data science libraries in Python.
6. SciPy: The Scientific Computing Powerhouse
Building upon the foundation laid by NumPy, SciPy is a comprehensive library that extends Python’s scientific computing capabilities to new heights. If NumPy is the engine, SciPy is the full-fledged toolbox, equipped with a wide range of modules for tasks like optimization, integration, interpolation, signal and image processing, and more.
Think of SciPy as a multi-tool for scientists and engineers. It provides you with the specialized instruments to tackle a diverse range of scientific and technical problems. Need to find the minimum of a complex function? SciPy’s optimization module can do that. Want to smooth out noisy data? Its signal processing tools are at your disposal.
SciPy’s versatility makes it an indispensable asset for data scientists working in fields like physics, engineering, biology, and finance, especially when used with other data science Python libraries. It allows you to perform complex calculations, analyze experimental data, and build sophisticated models with ease. Its seamless integration with NumPy and other Python libraries for data science ensures a smooth and efficient workflow for your scientific computing tasks.
The Exaloop Advantage: While SciPy offers a wealth of functionality, some of its modules—particularly those involving intensive numerical computations—can benefit from Exaloop’s performance optimizations. Exaloop can help you accelerate tasks such as solving differential equations, performing spectral analysis, or optimizing complex systems, allowing you to explore a wider range of possibilities and gain deeper insights into your scientific data.
7. Dask: Scaling Python for Big Data
As datasets grow in size and complexity, traditional Python libraries like Pandas and NumPy can start to show their limitations. Dask, a powerful library designed to parallelize and distribute computations across multiple cores or even clusters of machines, can solve this problem. Dask acts as a supercharged version of your favorite tools, able to handle datasets that would otherwise bring your computer to a crawl.
Dask provides familiar APIs that mirror those of Pandas and NumPy, making it easy to scale up your existing workflows with other Python libraries for data science—all without a steep learning curve. Need to analyze terabytes of data on your laptop? Dask can distribute the workload across multiple cores, significantly speeding up your analysis. Working with a cluster of machines? Dask can leverage their combined power to tackle even more massive datasets.
The Exaloop Advantage: While Dask seeks to scale Python through distributed computing, it doesn’t enhance Python’s notoriously poor performance itself. That’s where Exaloop comes in: Exaloop accelerates Python to native code speed and can even be used within other distributed computing frameworks like Dask.
Expanding Your Toolkit with Exaloop
While the Python libraries for data science discussed so far provide a solid foundation for data science workflows, Exaloop offers a unique opportunity to elevate your capabilities even further. By seamlessly integrating with your favorite Python libraries, Exaloop turbocharges their performance, enabling you to tackle larger datasets, more complex models, and more demanding analyses with remarkable speed and efficiency.
Exaloop’s high-performance Python execution engine is to leverage the power of parallel processing and hardware acceleration. It automatically distributes computations across multiple cores or GPUs, allowing you to harness the full potential of your hardware without having to write specialized code.
For data scientists, this translates to several key benefits:
- Eliminating Engineering Roadblocks: You can focus on the data science problem at hand, not on optimizing code for performance. Exaloop handles the heavy lifting, so you don’t need specialized software engineering skills to achieve significant speedups.
- Faster Time to Insight: Exaloop accelerates your workflows, such as training a machine learning model, running a complex simulation, or analyzing a massive dataset, enabling you to iterate more quickly and arrive at insights faster.
- Cost Savings: By maximizing the utilization of your existing hardware, Exaloop can help you reduce the infrastructure costs associated with cloud computing or high-performance computing clusters.
Exaloop truly shines in scenarios where performance is critical. For example, if you’re working with large-scale datasets that don’t fit comfortably in memory, Exaloop can seamlessly distribute the workload across multiple machines, enabling you to analyze the data efficiently. Similarly, if you’re training computationally intensive models, Exaloop can leverage GPUs to significantly speed up the training process.
In essence, Exaloop empowers you to think bigger and bolder with your data science projects. It removes the performance limitations that often hold back Python users, allowing you to focus on what you do best: extracting valuable insights from your data.
Conclusion: Streamline and Supercharge Your Data Science Journey
The world of data science is vast and ever-evolving. The Python libraries we’ve explored in this article represent just a fraction of the tools available to you, each offering unique capabilities to help you tackle specific challenges and unlock valuable insights from your data.
But remember: The power of these libraries is magnified when they’re combined with the right tools. With its ability to accelerate computations and eliminate performance bottlenecks, Exaloop empowers you to get the most out of your Python workflows. Whether you’re working with massive datasets, training complex models, or simply seeking to streamline your analysis, Exaloop can be your secret weapon for achieving faster, more efficient, and more impactful results.
If you’re ready to take your data science endeavors to the next level, try Exaloop to discover how it can transform your workflows. Don’t let slow tools hold you back.
FAQs
Can I use Exaloop with my existing Python libraries for data science?
Absolutely. Exaloop can use standard Python packages out-of-the-box, but also offers new, optimized implementations of several key libraries, including ones discussed in this article. This means you can continue using your familiar tools and workflows while benefiting from Exaloop’s speed and efficiency.
Which Python data science libraries benefit the most from Exaloop?
Exaloop’s optimized implementations of libraries like NumPy and Pandas include a number of new library-specific optimizations and are able to leverage its parallel processing and GPU capabilities, which can yield order-of-magnitude performance gains.
Is Exaloop only for large-scale data science projects?
While Exaloop excels at handling large datasets and complex models, particularly in terms of increasing throughput for data processing and analysis, it can also be used for applications that rely on smaller datasets or are latency-bound instead of throughput-bound.